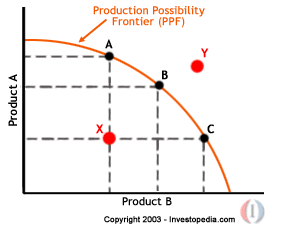
The Production Possibilities Curve (also called Production Possibilities Frontier) is a graph that shows the production of two goods or services using all limited resources to its full capacity. For example: if Good A was using all of the resources then you could not make any of Good B. With this information, economists can not only track the use of resources but which goods use the most resources. For example: Good A could need 3 trees to be made while Good B might only use 2. Also if there is a lack of a resource it will show on this kind of graph.
Also, these graphs you can see an insight into the economy. If there is a point on the inside of the curve that will show unemployment or not using resources to their full advantage. If the curve increases then that shows economic growth.


No comments:
Post a Comment